Scaling Chart Reasoning via Reliable Programmatic Synthesis from Scratch
Chart reasoning is a critical capability for Vision Language Models (VLMs). However, the development of open-source models is severely hindered by the lack of high-quality training data. Existing datasets suffer from a dual challenge: synthetic charts are often simplistic and repetitive, while the associated QA pairs are prone to hallucinations and lack the reasoning depth required for complex tasks.
To bridge this gap, we propose ChartVerse, a scalable framework designed to synthesize complex charts and reliable reasoning data from scratch:
We curate ChartVerse-SFT-600K and ChartVerse-RL-40K using Qwen3-VL-30B-A3B-Thinking as the teacher. Experimental results demonstrate that ChartVerse-8B achieves state-of-the-art performance, notably surpassing its teacher and rivaling the stronger Qwen3-32B-Thinking.
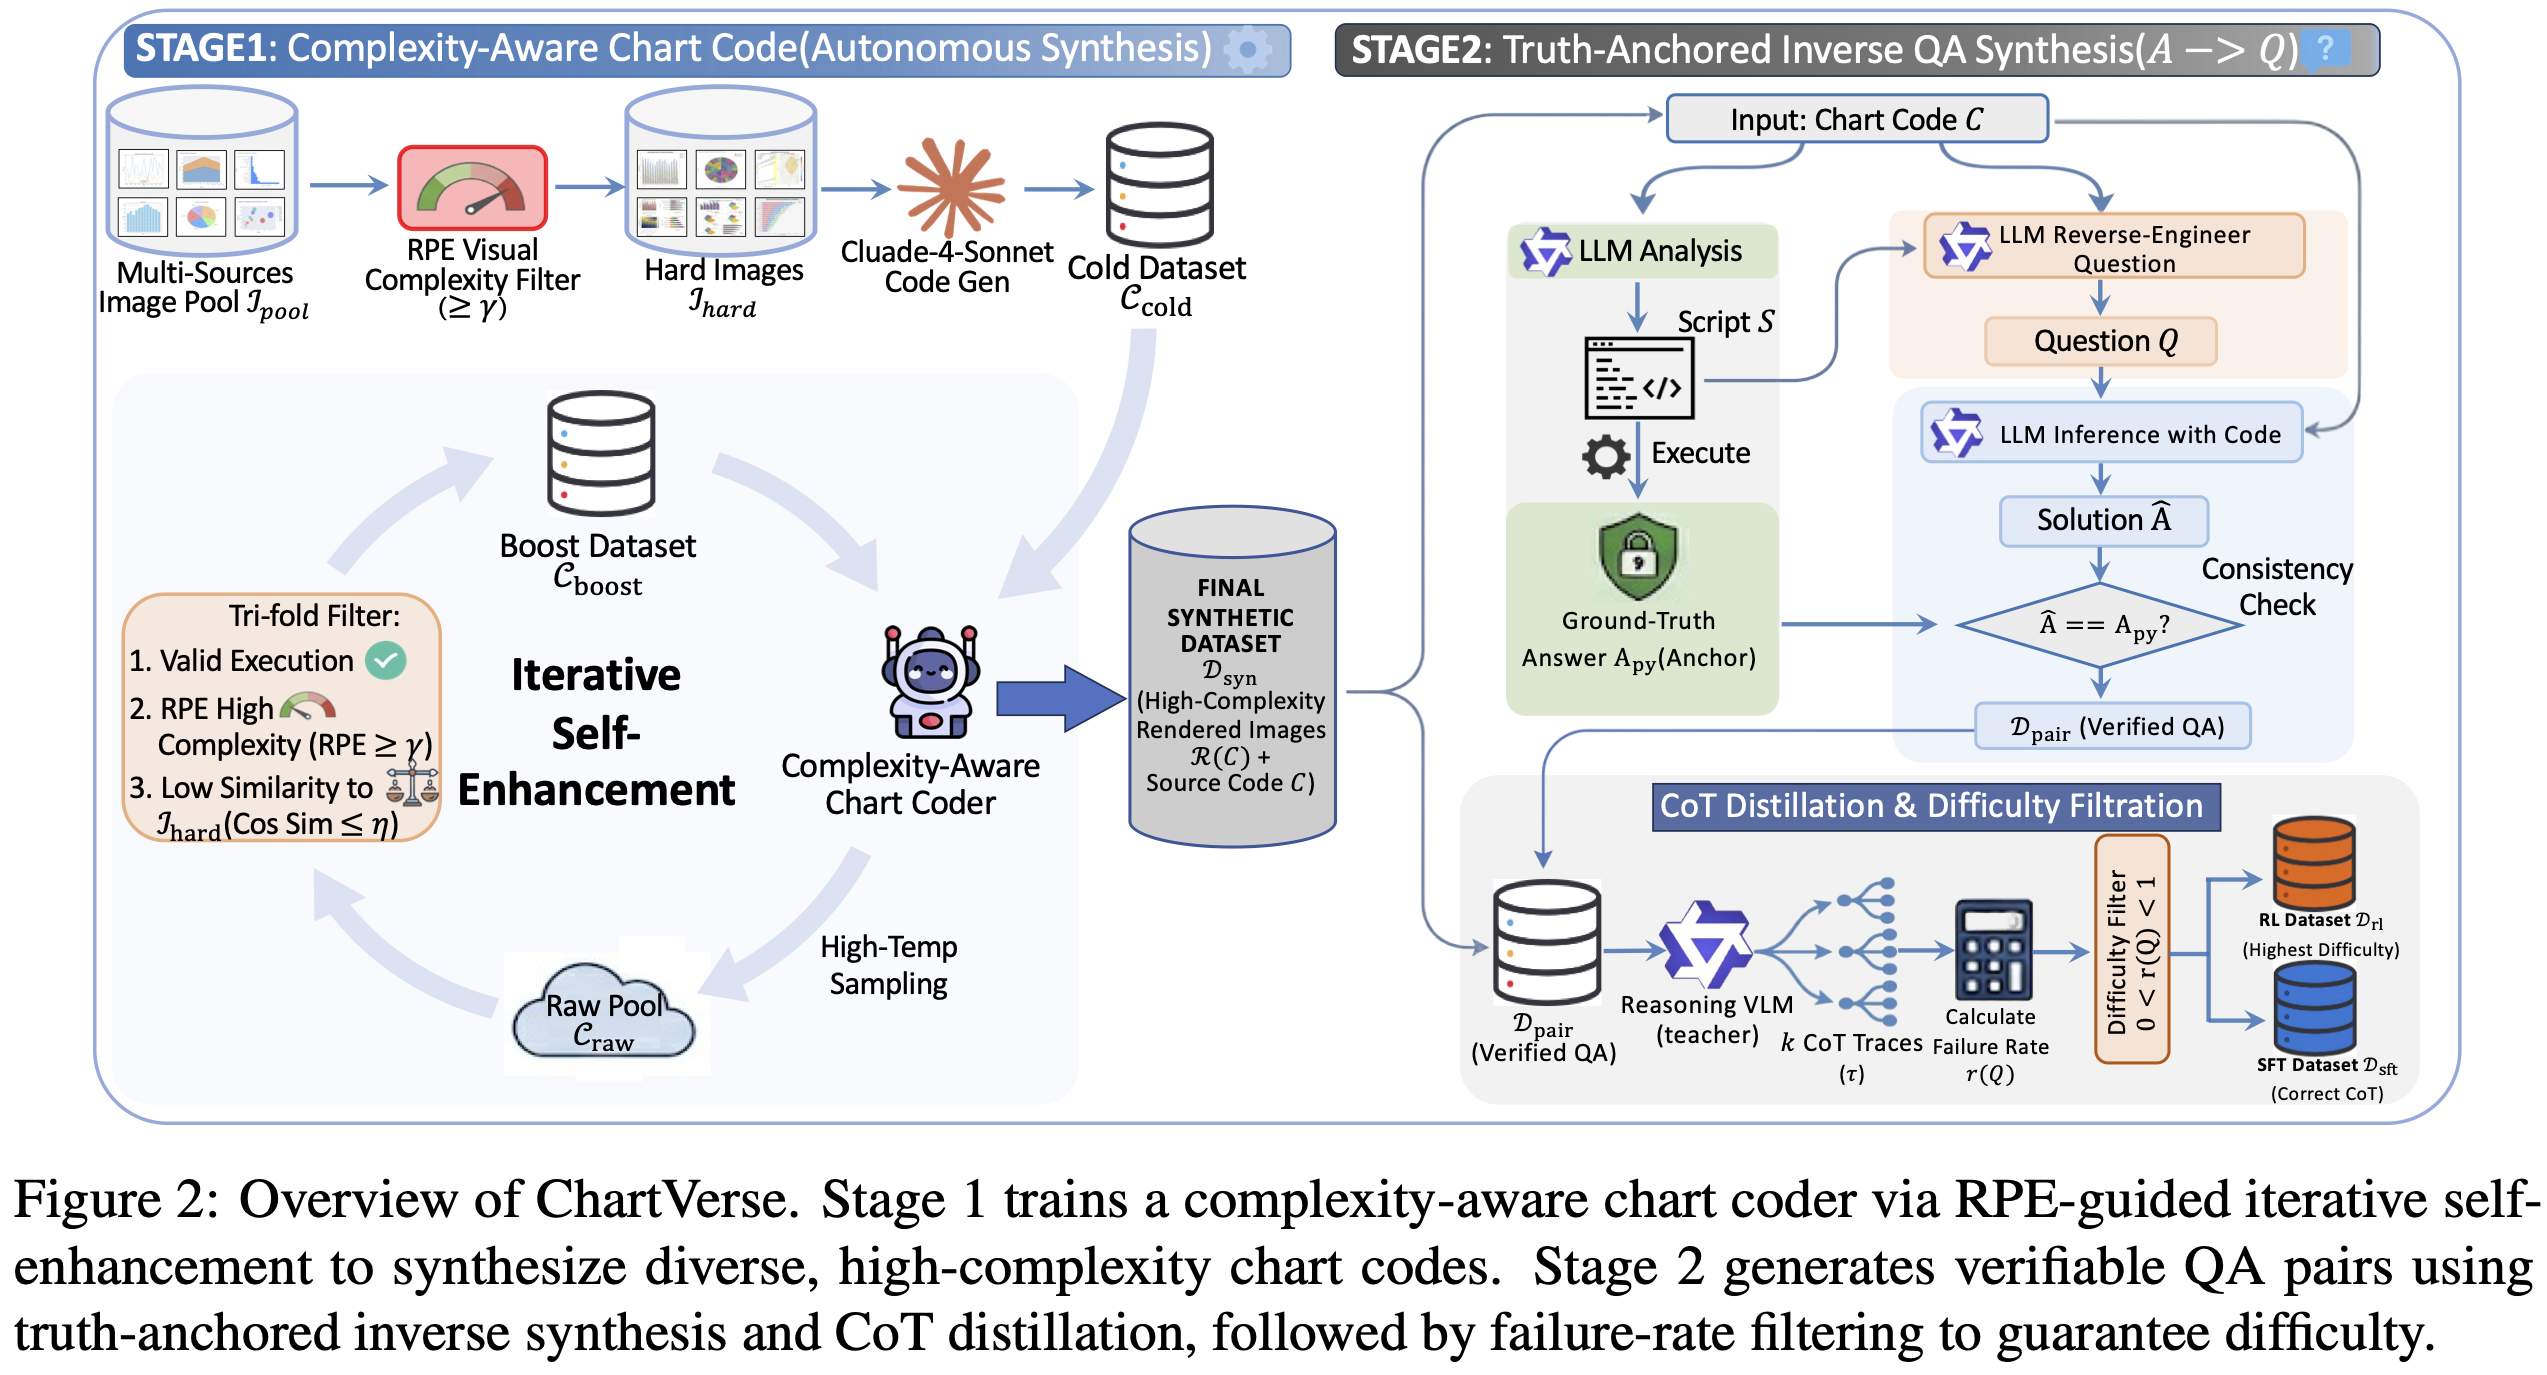
A two-stage framework combining complexity-aware chart synthesis with truth-anchored QA generation
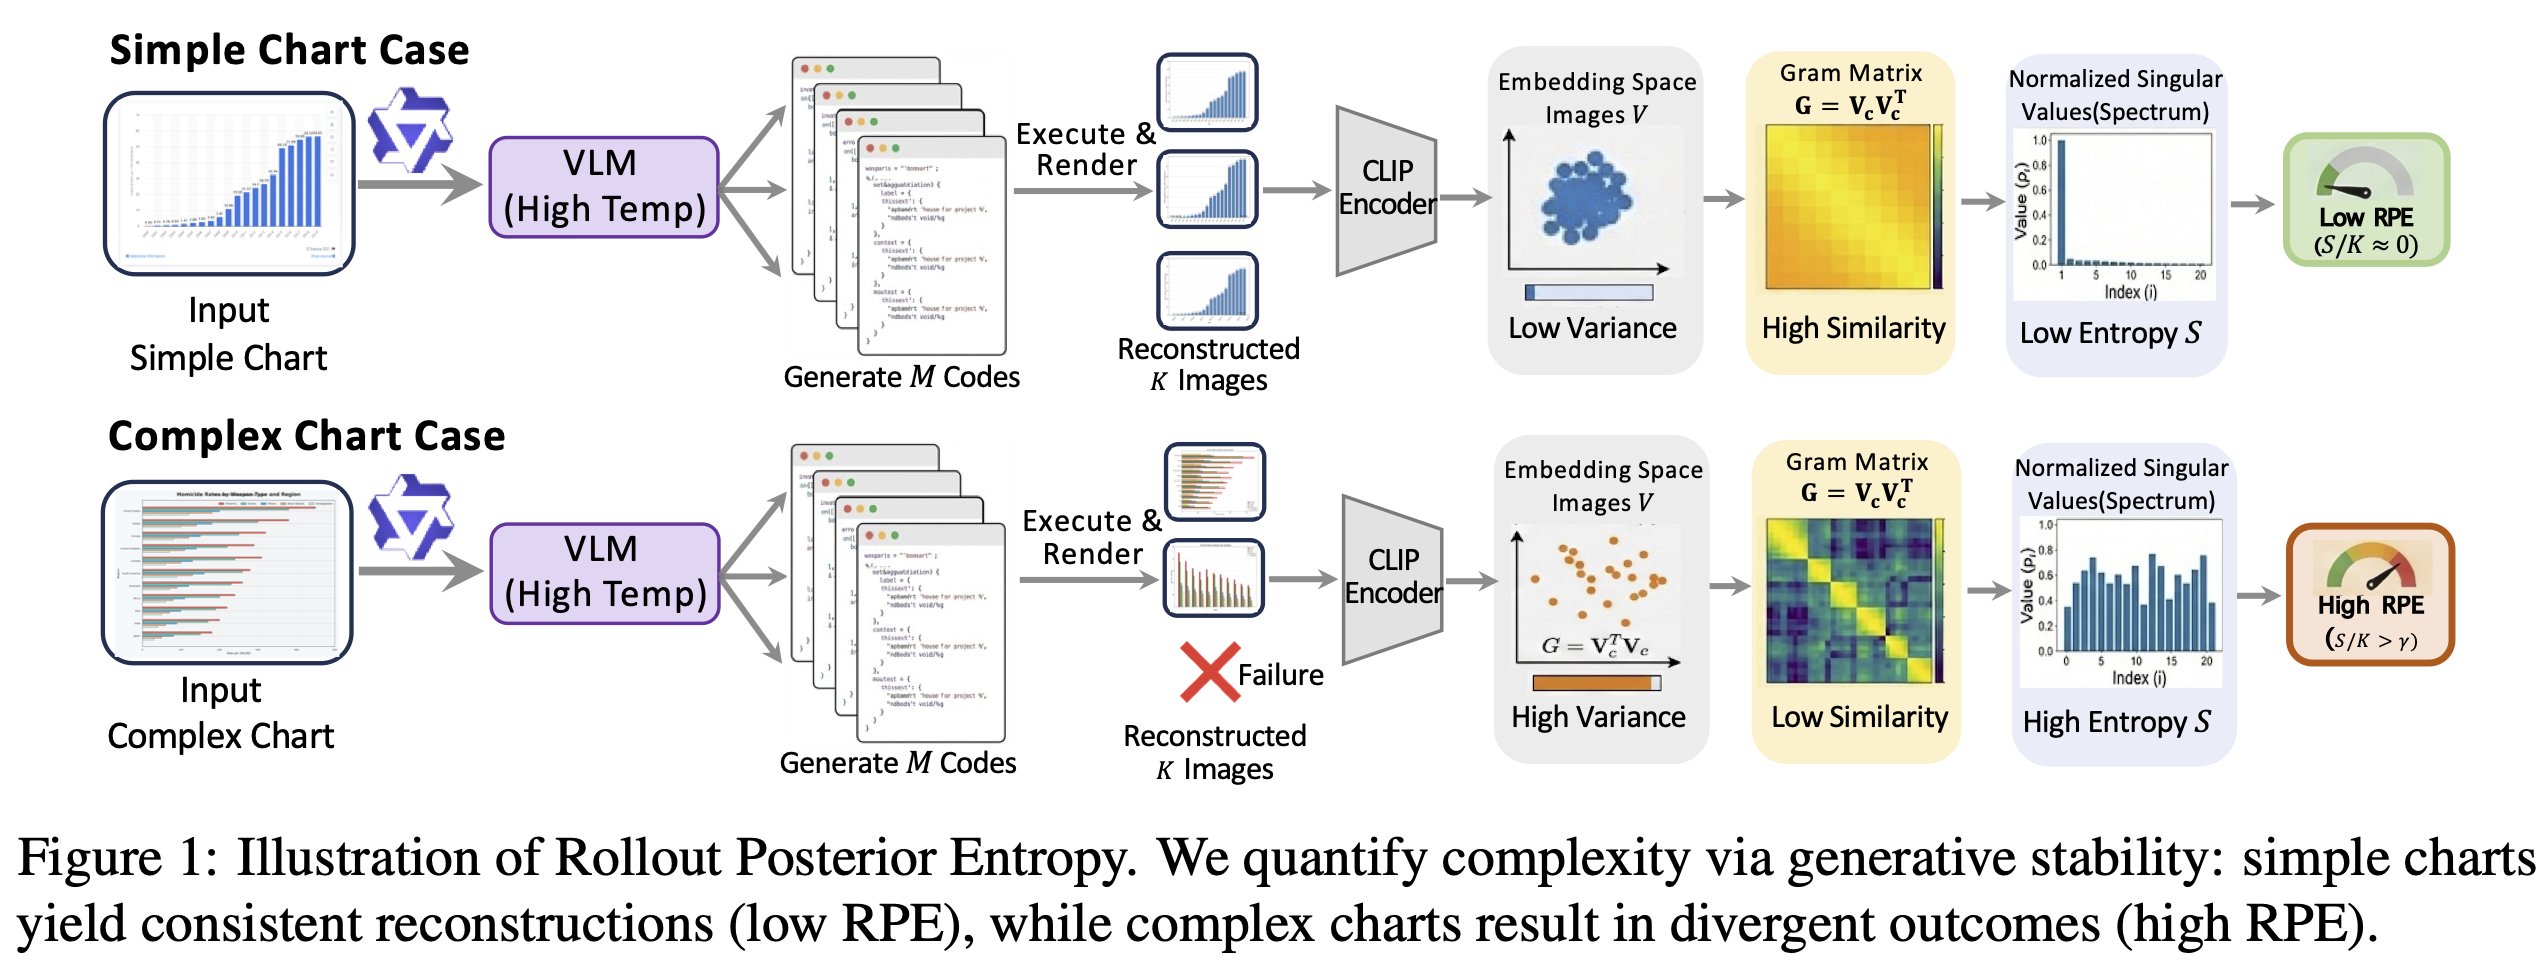
Given a chart, we prompt a VLM to generate executable code 8 times. Simple charts yield consistent codes, while complex ones lead to divergence. We compute spectral entropy from CLIP embeddings, retaining samples with RPE ≥ 0.4.
We train a specialized coder via iterative self-enhancement. Starting from a cold-start dataset filtered by high RPE, we repeatedly generate, filter by complexity and similarity, and retrain to produce diverse charts from scratch.
We invert the generation flow: first extract deterministic answers from code execution, then reverse-engineer questions. A consistency check ensures logical soundness. Failure-rate filtering retains challenging samples.
ChartVerse-SFT-600K achieves superior diversity, complexity, and reliability
| Dataset | Chart Count | Data Source | Textual Data | QA Count | Total Tokens | Answer Accuracy | Reasoning Data | Rollout Posterior Entropy ↑ | Color Entropy ↑ | Semantic Embedding Spread ↑ |
|---|---|---|---|---|---|---|---|---|---|---|
| ChartQA | 18K | Real + Synthetic | Table | 28K | 100K | ✗ | ✗ | 0.26 | 2.03 | 0.37 |
| PlotQA | 156K | Real + Synthetic | Table | 20M | 117M | ✗ | ✗ | 0.21 | 0.83 | 0.30 |
| FigureQA | 100K | Synthetic | - | 1.3M | 2.6M | ✗ | ✗ | 0.25 | 1.04 | 0.24 |
| ReachQA | 3K | Synthetic | Code | 20K | 1.2M | ✗ | ✓ | 0.29 | 1.91 | 0.47 |
| ECD | 10K | Synthetic | Code | 321K | 18.6M | ✗ | ✓ | 0.31 | 2.13 | 0.40 |
| CoSyn | 116K | Synthetic | Code | 1.1M | 5.4M | ✗ | ✗ | 0.35 | 1.73 | 0.54 |
| START | 400K | Synthetic | Code | 400K | 143M | ✗ | ✗ | 0.33 | 1.63 | 0.27 |
| ChartGen | 216K | Synthetic | Code | - | - | ✗ | ✗ | 0.30 | 1.31 | 0.39 |
| ChartCoder | 163K | Synthetic | Code | - | - | ✗ | ✗ | 0.33 | 1.48 | 0.38 |
| ChartVerse-SFT-600K (Ours) | 412K | Synthetic | Code | 603K | 3.9B | ✓ | ✓ | 0.44 | 3.17 | 0.51 |
Highest RPE score (0.44) compared to all baselines, indicating genuinely challenging visual structures.
Highest Color Entropy (3.17) and Semantic Embedding Spread, covering broad visual styles.
Guaranteed answer accuracy via inverse QA pipeline with code-execution verification.
Data quality triumphs over model scale—smaller ChartVerse models outperform much larger baselines
| Model | ChartQA-Pro | CharXiv (Reasoning) | CharXiv (Descriptive) | ChartMuseum | ChartX | EvoChart | ChartBench (GPT-acc) | Average |
|---|---|---|---|---|---|---|---|---|
| ECD-7B | 45.1 | 41.7 | 74.9 | 24.5 | 59.3 | 56.0 | 48.6 | 50.0 |
| START-7B | 43.5 | 46.3 | 76.8 | 29.7 | 57.3 | 63.8 | 50.0 | 52.5 |
| Chart-R1-7B | 45.6 | 47.7 | 70.0 | 33.4 | 60.9 | 67.1 | 50.5 | 53.6 |
| ChartVerse-2B | 48.2 | 46.9 | 71.2 | 37.5 | 60.5 | 66.8 | 49.1 | 54.3 |
| InternVL3.5-38B | 47.8 | 45.5 | 86.5 | 34.2 | 55.5 | 65.0 | 49.0 | 54.8 |
| InternVL3.5-241B-A28B | 50.7 | 47.5 | 88.1 | 36.1 | 59.1 | 67.4 | 48.6 | 56.8 |
| Qwen3-VL-8B-Thinking | 53.9 | 53.0 | 85.9 | 44.3 | 59.6 | 74.1 | 49.1 | 60.0 |
| ChartVerse-4B | 55.2 | 56.2 | 84.1 | 45.9 | 63.7 | 75.0 | 52.9 | 61.9 |
| Qwen3-VL-30B-A3B-Thinking | 55.8 | 56.6 | 86.9 | 49.2 | 62.3 | 77.2 | 52.4 | 62.9 |
| ChartVerse-8B | 56.2 | 60.8 | 88.0 | 49.2 | 63.9 | 76.2 | 54.2 | 64.1 |
| Qwen3-VL-32B-Thinking | 58.8 | 65.2 | 90.2 | 55.9 | 64.1 | 80.8 | 54.3 | 67.0 |
| Qwen3-VL-235B-A30B-Thinking | 60.0 | 66.1 | 90.5 | 60.0 | 64.5 | 79.9 | 54.5 | 67.9 |
ChartVerse-4B (61.9%) outperforms Qwen3-VL-8B-Thinking (60.0%) with half the parameters.
ChartVerse-8B (64.1%) surpasses its teacher Qwen3-VL-30B-A3B-Thinking (62.9%).
Our 8B model rivals the much larger Qwen3-VL-32B-Thinking on chart reasoning benchmarks.
| Model | ChartQA-Pro | CharXiv (Descriptive) | CharXiv (Reasoning) | ChartMuseum | ChartX | EvoChart | ChartBench | Chart Avg |
|---|---|---|---|---|---|---|---|---|
| Qwen3-VL-Instruct-2B | 42.1 | 62.3 | 26.8 | 23.9 | 49.8 | 53.6 | 38.8 | 42.5 |
| + SFT | 44.4 | 69.1 | 40.8 | 30.0 | 56.9 | 61.0 | 46.4 | 49.8 |
| + RL (ChartVerse-2B) | 48.2 | 71.2 | 46.9 | 37.5 | 60.5 | 66.8 | 49.1 | 54.3 |
| Qwen3-VL-Instruct-4B | 53.7 | 76.2 | 39.7 | 37.2 | 57.2 | 68.2 | 45.1 | 53.9 |
| + SFT | 52.9 | 84.5 | 52.8 | 42.5 | 61.9 | 73.3 | 50.3 | 59.7 |
| + RL (ChartVerse-4B) | 55.2 | 84.1 | 56.2 | 45.9 | 63.7 | 75.0 | 52.9 | 61.9 |
| Qwen3-VL-Instruct-8B | 54.4 | 83.0 | 46.4 | 39.6 | 58.2 | 70.2 | 46.6 | 56.9 |
| + SFT | 55.5 | 88.3 | 56.2 | 47.5 | 61.0 | 76.7 | 52.2 | 62.5 |
| + RL (ChartVerse-8B) | 56.2 | 88.0 | 60.8 | 49.2 | 63.9 | 76.2 | 54.2 | 64.1 |
The reasoning skills acquired from ChartVerse data transfer effectively to out-of-domain STEM reasoning tasks, demonstrating the general value of our high-quality chart reasoning data.
| Model | MathVista | DynaMath | MathVerse | LogicVista | VisuLogic | STEM Avg |
|---|---|---|---|---|---|---|
| Qwen3-VL-Instruct-2B | 61.3 | 52.1 | 54.2 | 35.8 | 11.5 | 43.0 |
| + SFT | 58.7 | 47.6 | 55.8 | 43.2 | 17.5 | 44.6 |
| + RL (ChartVerse-2B) | 60.4 | 49.2 | 56.8 | 48.5 | 23.1 | 47.6 |
| Qwen3-VL-Instruct-4B | 73.7 | 46.8 | 65.3 | 53.2 | 19.0 | 51.6 |
| + SFT | 70.9 | 60.7 | 71.1 | 57.3 | 25.0 | 57.0 |
| + RL (ChartVerse-4B) | 72.8 | 62.0 | 71.8 | 59.3 | 27.0 | 58.6 |
| Qwen3-VL-Instruct-8B | 77.2 | 62.1 | 67.7 | 55.3 | 22.5 | 56.7 |
| + SFT | 75.0 | 67.4 | 75.6 | 61.3 | 26.5 | 61.2 |
| + RL (ChartVerse-8B) | 75.6 | 69.0 | 76.5 | 62.6 | 27.1 | 62.2 |
Diverse, high-complexity charts synthesized by our Complexity-Aware Chart Coder
Complex questions with rigorous Chain-of-Thought reasoning
@article{chartverse2026,
title={ChartVerse: Scaling Chart Reasoning via Reliable
Programmatic Synthesis from Scratch},
author={Anonymous Authors},
journal={Anonymous ACL Submission},
year={2026}
}